UNITED STATES
SECURITIES AND EXCHANGE COMMISSION
Washington, D.C. 20549
SCHEDULE 14A
Proxy Statement Pursuant to Section 14(a)
of the Securities Exchange Act of 1934
(Amendment No. )
Filed by the Registrant ☒
Filed by a Party other than the Registrant ☐
Check the appropriate box:
| ☐ Preliminary Proxy Statement |
☐ Confidential, for Use of the Commission Only(as permitted by Rule 14a-6(e)(2)) | |
|
☐ Definitive Proxy Statement |
||
| ☒ Definitive Additional Materials | ||
| ☐ Soliciting Material Pursuant to §240.14a-12 | ||
EXXON MOBIL CORPORATION
(Name of Registrant as Specified In Its Charter)
(Name of Person(s) Filing Proxy Statement, if other than the Registrant)
Payment of Filing Fee (Check the appropriate box):
| ☒ | No fee required. |
| ☐ | Fee computed on table below per Exchange Act Rules 14a-6(i)(4) and 0-11. |
| (1) | Title of each class of securities to which transaction applies: |
| (2) | Aggregate number of securities to which transaction applies: |
| (3) | Per unit price or other underlying value of transaction computed pursuant to Exchange Act Rule 0-11 (set forth the amount on which the filing fee is calculated and state how it was determined): |
| (4) | Proposed maximum aggregate value of transaction: |
| (5) | Total fee paid: |
| ☐ | Fee paid previously with preliminary materials. |
| ☐ | Check box if any part of the fee is offset as provided by Exchange Act Rule 0-11(a)(2) and identify the filing for which the offsetting fee was paid previously. Identify the previous filing by registration statement number, or the Form or Schedule and the date of its filing. |
| (1) | Amount Previously Paid: |
| (2) | Form, Schedule or Registration Statement No.: |
| (3) | Filing Party: |
| (4) | Date Filed: |

2018 Executive Compensation Overview

Letter to Shareholders Fellow Shareholders, As you consider your vote on Management Resolution Item 3 – Advisory Vote Executive Compensation, the members of the Compensation Committee join recommending a review of this Executive Compensation Overview, in addition information in the Compensation Discussion and Analysis section of ExxonMo 2018 Proxy Statement. The Compensation Committee continues to support the overall design of this compensation program, because it recognizes the uniquely long-term nature o ExxonMobil’s business model and investment horizon, relies on a strong pay-fo performance standard, and results in a shared experience between ExxonMob executives and you, the long-term shareholders of our Company. We encourage you to vote “FOR” Item 3. Samuel J. Palmisano Chair, ExxonMobil Compensation Committee Shareholder Engagement Highlights Held 28 meetings with our largest shareholders throughout the calendar year – before, during, and after the proxy season Conducted shareholder webinar on May 11, 2017; next webinar scheduled for May 10, 2018 – Webinars allow the Company to gather input from all shareholders Shareholder feedback resulted in specific changes to the compensation program and improvements in the disclosure Say-On-Pay Results (“FOR”) 2013 2014 2015 2016 2017 71% 90% 90% 89% 69%

Executive Summary Key Messages – Why Vote “FOR” Say- On-Pay? Reduced 2017 performance share awards for CEO and other Compensation Named Executive Officers due to 10-year Total Shareholder Return (TSR) program links performance that is not leading average of industry peers (pages 2, 6, and 7) Company Industry-leading performance across all other metrics (pages 6 and 7) performance to Increase in 2017 earnings resulted in annual bonus program higher than executive pay 2016 (page 4) Pay for CEO position is at 42nd percentile of benchmark CEOs(1) (page 5) Executive pay Over 60 percent of CEO pay delivered in the form of performance shares, tied to with restriction periods of 5 years, 10 years, and longer (pages 2 and 3) shareholder Long restriction periods expose executives to the full impact of the commodity price cycle, and prevent monetization of awards before the experience impact of business decisions becomes known (pages 2 and 3) Confirmed the time period (10 years) used to determine Company performance against key metrics (pages 6 and 7) Shareholder feedback continues Decoupled performance metrics for the short-term bonus program from the long-term performance share program (page 4) to result in program and disclosure Provided more specificity as to how the Compensation Committee (CC) determines the size of annual performance share awards (page 2) improvements Clarified relative Company performance on key metrics against industry peers (table below and pages 6 and 7) Performance Share Program – Key Metrics and Results Safety & Return on Average Cash Flow from Strategic Objectives, Performance Total Shareholder Operations Capital Employed Operations and Business Results & Metrics (10-year) Return (TSR) Integrity* (ROCE)* Asset Sales Project Execution vs. U.S. Petroleum Rank Position Rank Position vs. Average of Assessment Criteria CC Assessment Industry Benchmark vs. Industry Peers vs. Industry Peers Industry Peers Status Leading Leading Leading Not Leading Strong Results (see page 7) *Highest priority metrics considered by CC 1

E X X O NM O B IL 2 0 18 E X E C U T I V E C O M P E N S AT I O N O V E R V I E W Performance Share Program Design Principles Shareholder alignment By design, the majority of executive compensation is delivered in performance shares, aligning executive pay with the experience of long-term shareholders Performance-based program using highest standards Level of performance share grant is determined by relative Company performance versus industry peers in five pre-established performance metrics Performance metrics applied at grant Enables performance and restriction periods of 5 years, 10 years, and longer. This is important because the alternative of applying performance metrics at vest would require line of sight to credibly and practically set targets, thus requiring shorter performance and restriction periods. Shorter performance and restriction periods would be misaligned with our business model and the experience of long-term shareholders Promotes retention and long-term view Majority of compensation delayed due to restriction periods up to three times longer than industry peers, with a significant portion restricted beyond retirement and at risk of forfeiture. This convention strengthens retention and achieves alignment with the experience of long-term shareholders Annual Process to Set Performance Share Grants Based on Business Performance and Market Orientation 100th percentile 1 Compensation Committee 2 CC assesses Company 3 CC affects future market 4 Stock price determines (CC) sets preliminary performance relative to orientation by determining final market orientation award levels, based on industry peers based number of shares at grant of compensation at vest, Median 42nd external benchmarking on pre-established based on relative Company 5 to 10+ years later percentile* performance metrics performance assessed in Step 2 percentile 0 2017 performance share award is over 60 percent of CEO’s reported 2017 compensation, and was reduced versus his 2016 performance share award, reflecting the Compensation Committee’s assessment of Company TSR performance per the process outlined above *Market orientation of CEO position over 10-year period from 2007 to 2016 (page 5, chart 4) Long Restriction Periods Longest restrictions in industry Restriction periods for senior executives far exceed typical three-year vesting that is common across most industries Restrictions aligned with investment lead times of business Performance shares vest 50 percent in 5 years from grant date and 50 percent in 10 years or retirement, whichever is later; vesting is not accelerated upon retirement Illustration of long-term orientation of performance share program Awards GRANTED — based on business performance and market orientation 2017 18 19 20 21 2022 23 24 25 26 27 28 2029 30 31 32 33 34 35 36 37 38 2039 Awards VEST — valued at share price when vested Illustration shows retirement at year-end 2029; last grant vests in 2039 2

Examples of Why Long Restriction Periods Align with ExxonMobil’s Business Model Example 1 Resource Development at Papua New Guinea (PNG) LNG Investment lead times in the oil and gas industry are often 10 years or longer 1993 ExxonMobil acquired interest in Hides field Mid-1990s Effort to develop Hides field to supply a future LNG development; 1997 Asian financial crisis and demand uncertainties led to the project being suspended 2004 Began effort to develop Hides field gas for supply by pipeline to Australia; project suspended in 2007 2009 PNG LNG full funding decision made, 16 years after initial investment 2014 PNG LNG start-up Example 2 The Commodity Price Cycle Vested Shares Available to Sell Immediately Prior to 2013 ExxonMobil’s longer restriction periods ensure that executives are required to hold Crude Oil Price Collapse (2) shares through the commodity price cycle 58% An alternate, formula-based program with short-term target setting and three- year vesting would enable executives to monetize performance shares at a much faster pace In this example, shares are granted to an executive each year over the most recent 7x 10-year period (2008-2017). In 2013, on the eve of a greater-than-50-percent more decline in crude price, only 8 percent of awards granted in the ExxonMobil program had vested. In the alternate program with three-year vesting, 58 percent of awards granted would have vested – 7 times more than the ExxonMobil program ExxonMobil executives, through this design feature of longer restriction periods, 8% are encouraged to take a long-term view in business decision-making ExxonMobil Alternate 3
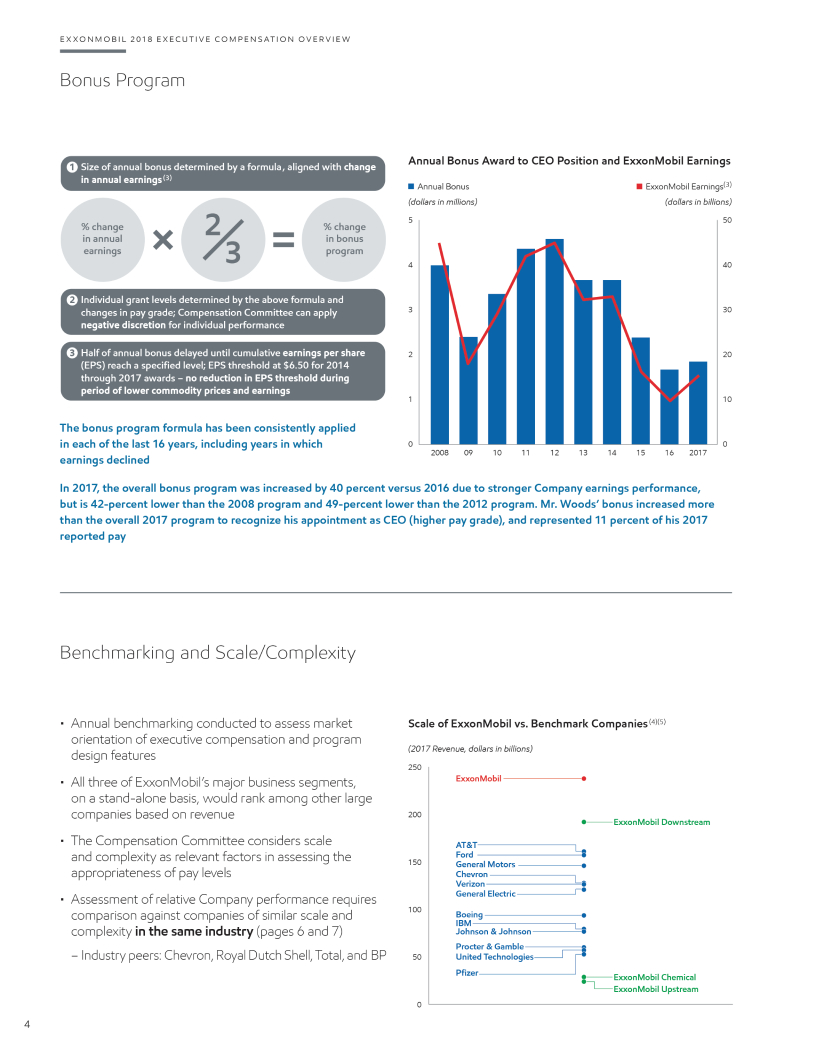
E X X O NM O B IL 2 0 18 E X E C U T I V E C O M P E N S AT I O N O V E R V I E W Bonus Program 1 Size of annual bonus determined by a formula, aligned with change Annual Bonus Award to CEO Position and ExxonMobil Earnings in annual earnings (3) Annual Bonus ExxonMobil Earnings(3) (dollars in millions) (dollars in billions) 5 50 % change 2 % change in annual in bonus earnings 3 program 4 40 2 Individual grant levels determined by the above formula and changes in pay grade; Compensation Committee can apply 3 30 negative discretion for individual performance 3 Half of annual bonus delayed until cumulative earnings per share 2 20 (EPS) reach a specified level; EPS threshold at $6.50 for 2014 through 2017 awards – no reduction in EPS threshold during period of lower commodity prices and earnings 1 10 The bonus program formula has been consistently applied in each of the last 16 years, including years in which 0 0 2008 09 10 11 12 13 14 15 16 2017 earnings declined In 2017, the overall bonus program was increased by 40 percent versus 2016 due to stronger Company earnings performance, but is 42-percent lower than the 2008 program and 49-percent lower than the 2012 program. Mr. Woods’ bonus increased more than the overall 2017 program to recognize his appointment as CEO (higher pay grade), and represented 11 percent of his 2017 reported pay Benchmarking and Scale/Complexity Annual benchmarking conducted to assess market Scale of ExxonMobil vs. Benchmark Companies (4)(5) orientation of executive compensation and program design features (2017 Revenue, dollars in billions) 250 All three of ExxonMobil’s major business segments, ExxonMobil on a stand-alone basis, would rank among other large companies based on revenue 200 ExxonMobil Downstream The Compensation Committee considers scale AT&T and complexity as relevant factors in assessing the Ford 150 General Motors appropriateness of pay levels Chevron Verizon Assessment of relative Company performance requires General Electric comparison against companies of similar scale and 100 Boeing IBM complexity in the same industry (pages 6 and 7) Johnson & Johnson Procter & Gamble – Industry peers: Chevron, Royal Dutch Shell, Total, and BP 50 United Technologies Pfizer ExxonMobil Chemical ExxonMobil Upstream 0 4

Compensation for CEO Position 1 Reported Pay 2 Reported Pay vs. Realized Pay Over 10-Year Period Pay granted to CEO position in 2017 is lower than 2016, reflective CEO’s realized pay represents, on average, 47 percent of total of new incumbent and decrease in the number of performance reported pay from 2008 to 2017 shares granted Salary Bonus Performance All Other Change in Reported Pay Realized Pay Share Award Compensation Pension Value (dollars in millions) (dollars in millions, rounded) 40 $3.0 $2.2 35 $0.5 $0.6 30 25 $18.3 $19.7 $3.3 $0.3 20 15 $10.8 10 $2.4 $1.7 5 $1.8 $3.0 $3.2 $1.2 0 2015 2016 2017 2008 09 10 11(6) 12 13 14 15 16 2017 Total Reported Pay: Realized Pay as a Percentage of Reported Pay: $27.3 $27.4 $17.5 32% 31% 49% 71% 39% 56% 55% 57% 53% 29% 3 Realized Pay vs. Benchmark Companies(7) 4 Realized and Unrealized Pay (7) Realized pay is below the median of compensation benchmark Combined realized and unrealized pay for CEO position from companies for most of the period between 2007 to 2016 2007 to 2016 is at the 42nd percentile of compensation benchmark companies ExxonMobil Compensation Benchmark Company: Median Highest Realized Pay: (dollars in millions) 80 37th 8 of 13 70 PERCENTILE POSITION 60 50 40 30 Combined Realized and Unrealized Pay: 20 42nd 8 of 13 10 0 PERCENTILE POSITION 2007 08 09 10 11(6) 12 13 14 15 2016 5
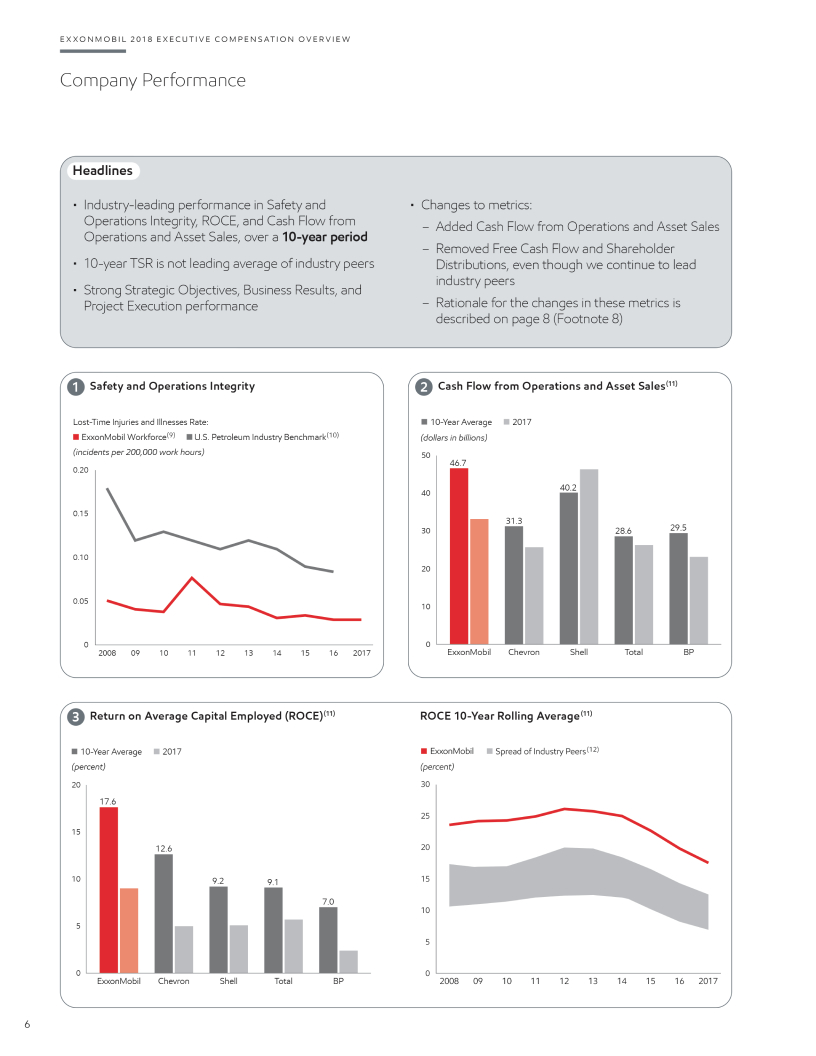
E X X O NM O B IL 2 0 18 E X E C U T I V E C O M P E N S AT I O N O V E R V I E W Company Performance Headlines Industry-leading performance in Safety and Changes to metrics: Operations Integrity, ROCE, and Cash Flow from – Added Cash Flow from Operations and Asset Sales Operations and Asset Sales, over a 10-year period – Removed Free Cash Flow and Shareholder 10-year TSR is not leading average of industry peers Distributions, even though we continue to lead Strong Strategic Objectives, Business Results, and industry peers Project Execution performance – Rationale for the changes in these metrics is described on page 8 (Footnote 8) 1 Safety and Operations Integrity 2 Cash Flow from Operations and Asset Sales (11) Lost-Time Injuries and Illnesses Rate: 10-Year Average 2017 ExxonMobil Workforce(9) U.S. Petroleum Industry Benchmark(10) (dollars in billions) (incidents per 200,000 work hours) 50 46.7 0.20 40 40.2 0.15 31.3 30 28.6 29.5 0.10 20 0.05 10 0 0 2008 09 10 11 12 13 14 15 16 2017 ExxonMobil Chevron Shell Total BP 3 Return on Average Capital Employed (ROCE) (11) ROCE 10-Year Rolling Average (11) 10-Year Average 2017 ExxonMobil Spread of Industry Peers(12) (percent) (percent) 20 30 17.6 25 15 12.6 20 10 9.2 9.1 15 7.0 10 5 5 0 0 ExxonMobil Chevron Shell Total BP 2008 09 10 11 12 13 14 15 16 2017 6

4 Total Shareholder Return (TSR)(13) Cumulative Shareholder Returns (13) 10-Year 2017 ExxonMobil Average of Industry Peers(12) Brent Price(14) (percent) (percent) (dollars per barrel) 30 40 120 25 30 80 20 20 40 15 10 10 0 0 6.8 5 3.2 3.6 –10 1.7 1.4 0 –20 Average –0.2 –5 of Industry –30 ExxonMobil Peers Chevron Shell Total BP 2008 09 10 11 12 13 14 15 16 2017 5 Strategic Objectives, Business Results, and Project Execution (15) Upstream Growing value by upgrading resource portfolio Environmental Responsibly providing energy to meet growing needs of the world Added 9.8 billion net oil-equivalent barrels of new resource, reflecting strategic acquisitions and exploration success Achieved significant milestones in algae research as well Added 2.8 billion oil-equivalent barrels of proved reserves, as carbon capture and storage research 189-percent replacement of 2017 production(16) Implemented enhanced methane reduction program Captured 53 million exploration acres (gross) Financial Unparalleled financial strength provides Added over 200,000 oil-equivalent barrels per day of competitive advantage gross production capacity through start-ups at Hebron and Strongest balance sheet relative to industry peers supports Odoptu Stage 2 pursuit and capture of all attractive opportunities Downstream Providing highest-value products through most capital-efficient means 2017 Total Capitalization and Leverage (11)(17) Completed four major Downstream projects to improve profitability through expanded logistics capabilities for (Total Capitalization, dollars in billions) greater market access and improved energy efficiency 500 Entered new markets in Mexico and Indonesia with fuels ExxonMobil and lubricant branded sales 400 Shell Chemical Strengthening major integrated complexes and 300 leveraging unique position to capture demand growth Chevron Invested $3.8 billion in specialty businesses, advantaged feedstock, and integration 200 Total BP Increased aromatic production in Singapore to over 3.5 million tonnes per annum (MTA) by acquiring Jurong 100 Aromatics Corporation Added 1.3 MTA new polyethylene capacity at Mont Belvieu, 0 5 10 15 20 25 Texas, plant (Leverage, percent) 7

E X X O NM O B IL 2 0 18 E X E C U T I V E C O M P E N S AT I O N O V E R V I E W Sound Governance Practices Long restriction periods on performance shares result in required ownership CEO Stock Ownership that far exceeds typical stock ownership guidelines among compensation as Multiple of Base Salary benchmark companies ExxonMobil 36x —Executives see a one-for-one change in compensation through share price, aligned with the experience of long-term shareholders —At retirement, ExxonMobil senior executives continue to have performance shares unvested and at risk of forfeiture for 10 years —Unvested performance shares and the delayed payout of half of the annual bonus are subject to forfeiture for resignation or detrimental activity, with no accelerated payout at retirement Bonus clawback policy Typical guideline among compensation No employment contracts, severance agreements, or change-in-control benchmark companies arrangements for the CEO and other Named Executive Officers 6x No guaranteed bonuses or additional grants to balance changes in value of prior grants Footnotes (1) Pay means the sum of Realized Pay and Unrealized Pay as described in more detail on page 5 and in the related Frequently Used Terms on page 9. (2) In Example 2, for both the ExxonMobil and Alternate programs, 100 shares are granted each year from 2008 to 2017. For ExxonMobil performance share program, 50 percent of an annual grant of performance shares vests in 5 years and the other 50 percent vests in 10 years or retirement, whichever is later. For the hypothetical alternate formula-based program, shares would vest after 3 years based on TSR performance. Values shown represent percent of target shares that would pay out based on ExxonMobil’s actual relative three-year TSR rank versus our industry peers (see footnote 12). Payout schedule as follows: 200% of target if ranked 1; 150% of target if ranked 2; 100% of target if ranked 3; 50% of target if ranked 4; and, 0% of target if ranked 5. (3) Bonus program is based on estimates of year-end earnings made in November of each year, such that payment can occur in that calendar year. The purpose of the two-thirds adjustment in the formula is to mitigate the impact of commodity price swings on short-term earnings performance. (4) Benchmark companies are the same companies noted in the 2017 Proxy Statement, except that General Motors replaced Caterpillar. See Frequently Used Terms on page 9 for a full list of benchmark companies. (5) Benchmark company data based on public information. Data represents the fiscal year ending in 2017. Excludes sales-based taxes and intersegment revenues. (6) Exercised last stock options granted in 2001 that would have expired in 2011. No stock options granted since 2001. (7) 2017 benchmark company data not available at time of publication. (8) Replaced Free Cash Flow (FCF) with Cash Flow from Operations and Asset Sales (CFOAS). CFOAS is more likely to drive desired behavior, as it focuses on cash generation and is neutral to uses of cash; FCF maximization could discourage investment. Removed Shareholder Distributions, as the Total Shareholder Return (TSR) metric reflects the value of dividend growth and share buybacks over time; distribution yield could inappropriately benefit from stock price decreases and vice versa. (9) Employees and contractors, includes XTO Energy Inc. data beginning in 2011. (10) Workforce safety data from participating American Petroleum Institute (API) companies; 2017 industry data not available at time of publication. (11) Competitor data estimated on a consistent basis with ExxonMobil and based on public information. ROCE data for Total available from 1999. For definitions and more information, see Frequently Used Terms on page 9. (12) Industry peers include Chevron, Royal Dutch Shell, Total, and BP. (13) Growth rate of an investor’s holdings with reinvestment of dividends. Chevron, Royal Dutch Shell, Total, and BP weighted by market capitalization. (14) Annual data calculated as average of daily prices from Platts. (15) For more information, see the Summary Annual Report included with the Corporation’s 2018 Proxy Statement and available on our website at exxonmobil.com/annualreport. (16) Proved reserves exclude asset sales. (17) Total Capitalization defined as “Net Debt + Market Capitalization”; Leverage defined as “Net Debt / Total Capitalization.” 8

Frequently Used Terms Please also read the footnotes on page 8 for additional Unrealized Pay is calculated on a different basis than definitions of terms we use and other important information. the grant date fair value of awards used in the Summary Compensation Table. Unrealized Pay includes the value based Performance Share Program is the terminology used to on each compensation benchmark company’s closing stock describe our equity program to better reflect the strong price at fiscal year-end 2016 of unvested restricted stock connection between performance and pay. awards; unvested long-term share- and cash performance awards, valued at target levels; and the “in the money” value of unexercised stock options (both vested and unvested). If a Compensation Benchmark Companies consist of AT&T, CEO retired during the period, outstanding equity is included Boeing, Chevron, Ford, General Electric, General Motors, assuming that unvested awards, as of the retirement date, IBM, Johnson & Johnson, Pfizer, Procter & Gamble, continued to vest pursuant to the original terms of the award. United Technologies, and Verizon. For consistency, CEO compensation on page 5, in charts 3 and 4, is based on compensation as disclosed in the Summary Compensation Cash Flow from Operations and Asset Sales is the sum of Table of the proxy statements as of July 31, 2017. the net cash provided by operating activities and proceeds associated with sales of subsidiaries, property, plant and equipment, and sales and returns of investments from Reported Pay is Total Compensation reported in the the Summary Statement of Cash Flows. For additional Summary Compensation Table, except for 2008, where the information, see page 37 of the Summary Annual Report grant date value of restricted stock as provided under current included with the Corporation’s 2018 Proxy Statement. SEC rules is used to put all years of compensation on the same basis. Return on Average Capital Employed (ROCE) for the Corporation is net income attributable to ExxonMobil Realized Pay is compensation actually received by the CEO excluding the after-tax cost of financing, divided by total during the year, including salary, current bonus, payouts corporate average capital employed. For this purpose, capital of previously granted earnings bonus units (EBUs), net employed means the Corporation’s net share of property, spread on stock option exercises, market value at vesting plant and equipment, and other assets less liabilities, of previously granted stock-based awards, and All Other excluding both short-term and long-term debt. For additional Compensation amounts realized during the year. It excludes information, see pages 36 and 37 of the Summary Annual unvested grants, change in pension value, and other amounts Report included with the Corporation’s 2018 Proxy Statement. that will not actually be received until a future date. Amounts for compensation benchmark companies include salary, bonus, payouts of non-equity incentive plan compensation, Total Shareholder Return (TSR) measures the change in and All Other Compensation as reported in the Summary value of an investment in stock over a specified period of Compensation Table, plus value realized on option exercise or time, assuming dividend reinvestment. TSR is subject to many stock vesting as reported in the Option Exercises and Stock different variables, including factors beyond the control of Vested table. It excludes unvested grants, change in pension management. For additional information, see page 36 of value, and other amounts that will not actually be received the Summary Annual Report included with the Corporation’s until a future date, as well as any retirement-related payouts 2018 Proxy Statement. from pension or nonqualified compensation plans. Statements regarding future events or conditions are forward-looking statements. Actual future results, including project plans, schedules, and results, as well as the impact of compensation incentives, could differ materially due to changes in oil and gas prices and other factors affecting our industry, technical or operating conditions, and other factors described in Item 1A Risk Factors in our most recent Form 10-K. References to oil-equivalent barrels and other quantities of oil and gas herein include amounts not yet classified as proved reserves under SEC rules, but which are expected to be ultimately moved into the proved category and produced in the future. The term “project” can refer to a variety of different activities and does not necessarily have the same meaning as in any government payment transparency reports. 9

Exxon Mobil Corporation Corporate headquarters 5959 Las Colinas Blvd. Irving, Texas 75039-2298 exxonmobil.com 002CSN8C5A Printed in U.S.A.